Dashboards & Reports
Ask the numbers. Get a chart back.
Dashboards for every desk — the owner, the team lead, each advisor — built from your own data and pinned where you'll see them. Ask in plain English and the answer comes back; AI suggests the reports worth keeping.
- dashboards in the demo workspace
- 21
- chart types
- 40+
- your go-to boards to the sidebar
- Pin
- report suggestions from your data
- AI
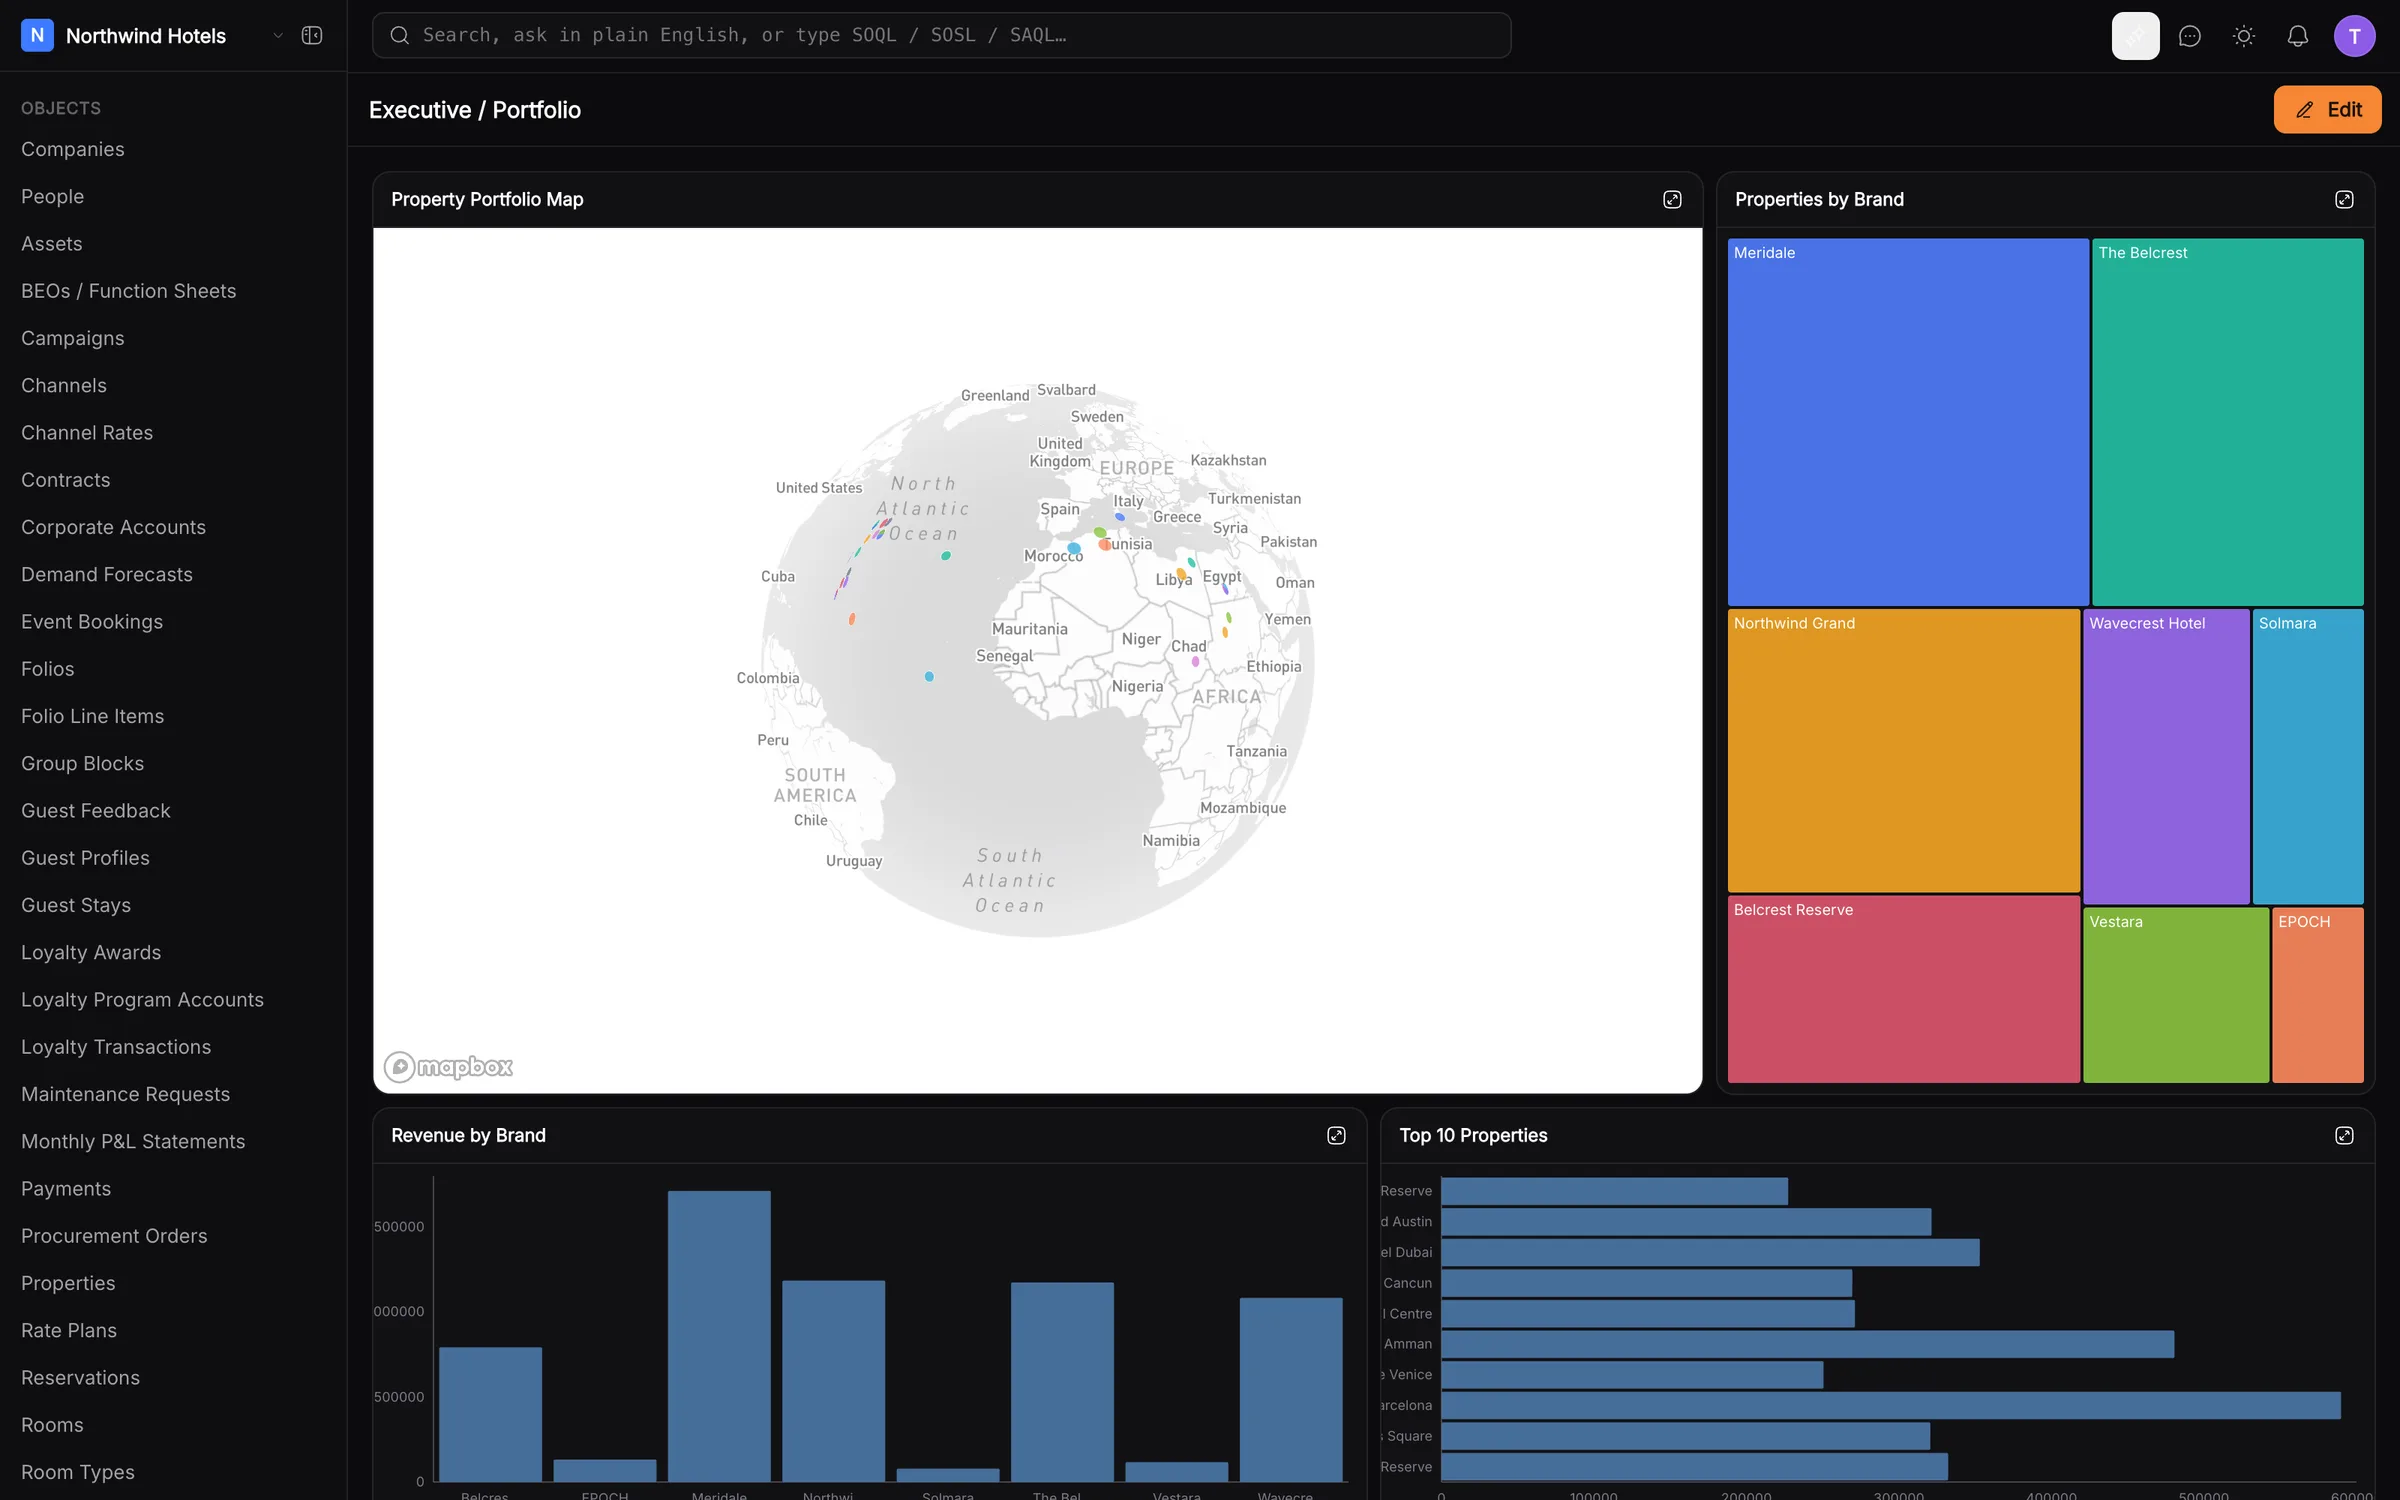
Dashboards
A dashboard for every desk
An executive overview for the owner, team performance for the lead, my performance for each advisor — build your own from saved reports, and change them as the business changes.
- KPI tiles, charts and leaderboards on one board
- Pin the boards you use to the sidebar
- Edit any dashboard in place
KPIs
The numbers that matter, pinned
Revenue, commission, active clients, claims paid — turn a report into a tile and keep it in view. Open any chart full size when you need the detail.
- KPI, gauge, funnel and waterfall charts
- Leaderboards for team performance
- Record-level charts on every record
Reports
Reports without a spreadsheet
Pick a source, choose columns, group, total and filter, then show it as a table, a chart or both. The demo keeps reports like Upcoming Renewals (Next 30 Days), Premium by Insurer and Agent Leaderboard — and AI suggests more from your data.
- Table, chart or both, per report
- Totals from counts and sums to percentiles
- AI report suggestions, checked before you see them
Ask
Ask in plain English
Type a question — which renewals are due this month, by owner? — and klerc turns it into the right query and answers. Analysts can still write SOQL, SOSL or SAQL in the query console.
- Plain-English questions in the search bar
- Full-text search across every object
- A query console for power users
Also in the box
Pinned dashboards
Pin the dashboards you use most so they sit in the sidebar.
Descriptions
Give each dashboard a description, so the team knows what it's for.
Full-size charts
Open any tile full size to read the detail.
Chart recommendations
klerc suggests a chart type from the shape of your data.
Permission-aware
Reports only count the records each person is allowed to see.
Fast at scale
Analytics run on a columnar copy of your data, synced as you work.
Put your agents to work.
Bring your team, connect your channels and let klerc take the follow-ups — from first hello to paid invoice.
Free during early access. No credit card needed.